|
|
||

|
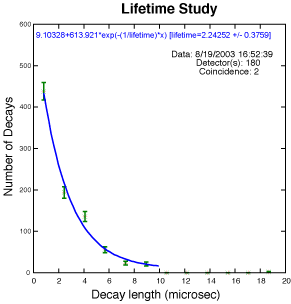
Muon decay follows an exponential law—just like radioactive decay and many other natural phenomena. Exponential plots have a characteristic shape. Finding the value of the exponent leads to the mean lifetime of the particle—one of many characteristics that allow us to describe particles. Others include mass and electric charge.
We measure the time between two signals in the same counter and look for patterns in the time difference between two consecutive signals. The difference may result from a muon decay. Two types of background noise are minimized in the accompanying example.
If we plot a histogram of the length between signals for many of these candidate decays using the e-Lab tool, we can fit the result with an exponential distribution for the decays plus a flat component for any random backgrounds. The mean lifetime from that fit is shown in the plot as 2.2 microseconds. |
|
