| DMT |
DMT
The Data Monitoring Tool (DMT) is a LIGO software subsystem that performs various tasks on raw data that LIGO collects. These tasks might include the filtering of data or the application of calibrations to the data to associate it with relevant units of measurement. In the LIGO e-Lab, the frequency-filtered channels of seismometer data belong to the DMT subsystem because these channels have been processed from the raw data which comes from the PEM subsystem.
External Links:
Data Monitoring Tool
|
| GDS |
Global Diagnostic System
The Global Diagnostic System (GDS), like the DMT, is a software subsystem that
takes raw data from sensors such as seismometers and performs processes on the data to help answer certain questions.
Only one GDS sensor (channel) is available in the e-Lab. This is an earthquake monitor.
If operating correctly, this GDS channel gives plots that show when earthquake waves pass by LIGO.
|
| LVEA |
Laser and Vacuum Equipment Area (LVEA)
The Laser and Vacuum Equipment Area (LVEA) is the area where the beam tubes meet in a LIGO detector. LIGO's interferometers have an "L" shape.
The LVEA is the interior of the building at the vertex of the L. The LVEA is a laser safety area that requires special precautions and clean room clothing for entry.
There is a seismometer in each LIGO LVEA that is part of the e-Lab data network.
|
| PEM |
Physics Environment Monitoring
The LIGO Physics Environment Monitoring (PEM) system draws in about 100 channels of data from seismometers, tiltmeters, magnetometers,
electrical-line monitoring equipment, weather stations, radio-frequency monitors and a cosmic-ray-shower detector. PEM data are used to learn how the interferometers
are affected by changes in the physical environment, and to check whether environmental parameters were "nominal" when candidate gravitational-wave events were recorded.
|
| TAI |
TAI
International Atomic Time. This is a timekeeping system based on the ticking of 200 highly precise atomic clocks around the world.
TAI does not take into account the slowing of the Earth’s rotation.
|
| UTC |
UTC
Coordinated Universal Time. UTC is a time standard that is shared by civil and technical timekeeping systems across the world.
UTC is accurate to within about a billionth of a second per day.
|
| abstract |
Abstract: An abstract is a shortened version of the paper and should contain all information necessary for the reader to determine:
- the objectives of the study were;
- the procedure of the study;
- the results of the study;
- the significance of the results.
|
| bandwidth filtered |
Bandwidth-filtered
This phrase refers to the process of splitting LIGO�s raw seismometer data into frequency bands.
Data from a particular frequency band is called �bandwidth filtered.� Computers are programmed to apply mathematical filters to the raw data.
The nature of the filter will determine the width of the frequency and that it creates.
|
| data channel sampling |
Sampling
For DMT channels, you will see rms as the only option in this field. For PEM channels you will see rms and mean.
rms stands for "Root Mean Square" and is calculated by squaring each individual value in the data set,
summing all the squared values, dividing the sum by the number of values and taking the square root.
Beware of choosing mean when looking at PEM channels. The mean sometimes will cause the (+) and (-) swings in the
seismometer signals to cancel out, leading the investigator to conclude that the seismic signal was smaller than was actually the case.
|
| data channel sensor |
Data Channel Sensor
Each seismometer at LIGO contains three individual sensors labeled x, y and z. The x and y sensors measure horizontal vibrations in perpendicular directions,
in the directions of the x and y arms of the interferometer. The z sensor measures vertical vibrations.
In the DMT subsystem, data from each of these sensors on each seismometer is filtered into five different
frequency bands. That's why you see so many entries on the sensor list in the DMT subsystem.
There are six seismometers at the LIGO Hanford site and four at LIGO Livingston, one in each station plus the vault.
Each seismometer has three sensors, and, in the DMT subsystem, the signal from each sensor is filtered into five different
bandwidth-filtered channels.
So it is important to distinguish between a "channel" of data and the "sensor" that it came from -- they are different things.
|
| data channel source |
Data Channel Source
This is the field named Site in the interface.
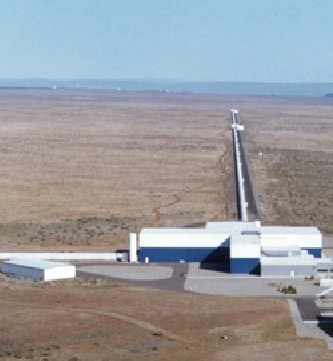
LIGO operates two gravitational wave detector facilities. H0 in the Site
field refers to LIGO Hanford Observatory (LIGO Hanford) in southeastern Washington.
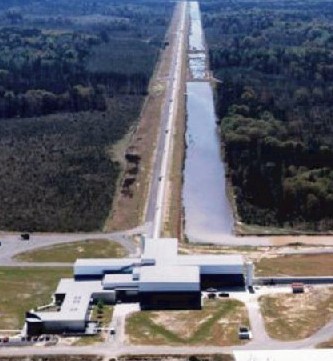
L0 refers to LIGO Livingston Observatory in Louisiana (LIGO Livingston).
|
| data channel station |
Data Channel Station
Station refers to the LIGO building in which a particular seismometer is located.
LIGO Livingston has four stations, the LVEA
(also called the corner station), the End X station (EX), the End Y station (EY) and a Vault.
LIGO Hanford has the same four stations plus two more*, the Mid X station (MX) and the Mid Y station (MY).
The "Vault" stations are concrete vaults in the ground outside of LIGO's buildings.
The Vault seismometers are placed in these enclosures. The LVEA, Mid and End station seismometers are placed
on the concrete floors of LIGO's buildings.
Use the LIGO Maps link on the Resources list (Library menu) in the e-Lab to find a LIGO site diagram
that shows the locations of the stations.
LIGO Hanford operates two gravitational wave interferometers (H1 and H2) and LIGO Livingston operates one (L1).
Before Advanced LIGO, one of Hanford's detectors (H2) was 2 kilometers on a side. The Mid Station buildings at LIGO Hanford
housed the end mirrors for this 2-km detector. Advanced LIGO will result in the conversion of H2 to a four-kilometer detector, the same length as H1 and L1.
The Mid Station buildings will remain, as will the MX and MY seismometers inside them.
|
| data channel subsystem |
Data Channel Subsystem
LIGO data at each LIGO site is organized into three subsystems:
|
| data selection |
Data Selection
You will make choices in the fields below to ask for the data that you want to plot. You will choose a
Site,
Subsystem,
Station,
Sensor and
Sampling type.
Click on the question marks next to these labels to find glossary entries that will help you understand each field. You can plot more than one data set at a time by clicking "Add Data Row" and making your choices for the second (or more) data set.
Click the "Plot" button to make the graph. Click the "Remove Data Row" button and "Plot" to re-draw the graph without the data set you've removed.
|
| elog |
Elog
The LIGO E-Log is an electronic logbook which LIGO uses as the master record of detector operations.
LIGO personnel are required to make E-Log entries for all circumstances related to the operation of the detectors and any changes that are made to the detectors.
"If it's not in the E-Log, it didn't happen." The E-Logs are viewable on the Web using the links below and the access words "reader" and "readonly" (no quotes).
e-Lab users might find LIGO's E-Logs helpful because the E-Logs often mention seismic disturbances that affect the detectors.
External Links
LIGO Handford Electronic Logs
LIGO Livingston Electronic Logs
|
| frequency bands |
Frequency Bands
The term �band� refers to a range of frequencies. For instance the phrase �audio band� refers to the range of frequencies that humans can hear,
roughly 20 Hz to 20,000 Hz (20 KHz). LIGO separates its raw seismometer data into six different frequency bands.
Each band tells LIGO scientists something different about the way that the ground shakes at LIGO�s Observatory sites.
|
| gps time |
GPS Time
GPS time is the time that is measured on atomic clocks on GPS satellites.
Time zero in the GPS system was 00:00:00 (midnight) on 6 January 1980 UTC.
GPS time does not account for the lengthening of days because of the slowing rotation of the Earth, so, unlike
UTC, GPS time does not use
leap seconds.
Otherwise it progresses at the same rate as UTC and
TAI.
External Links
Timescales
LIGOtools Package: time
|
| leap seconds |
Leap Seconds
Solar time is a timekeeping system that's based on the Sun's position in the sky.
UTC is a timekeeping system that�s based on seconds that tick by on highly precise atomic clocks.
The Earth's rotation isn't highly regular. Eventually these irregularities would cause solar time and UTC to grow apart from each other,
a circumstance that would cause disruptions in a number of areas of human activity. The keep UTC aligned with solar time,
leap seconds occasionally are added to or subtracted from UTC time.
Usually leap seconds are added because tidal forces tend to lengthen the Earth's period of revolution.
|
| metadata |
Metadata (meta data, or sometimes metainformation) is "data about other data". The e-Lab stores metadata for the Cosmic Ray data files, plots and posters.
Searching metadata is a powerful way to find the data you want. Read more about metadata on Wikipedia.
|
| microseism |
Microseism
Microseism literally means "small earthquake". Microseisms are continuous low-frequency seismic tremors that are caused by ocean waves.
You can watch the microseismic signal change at LIGO by plotting the 0.1 - 0.3 Hz seismic channels in the DMT subsystem: SEIS(X,Y,Z)_0.1_0.3Hz.
|
| milestone |
 Scientists have software to plan and track their projects. Our online version includes these milestones with references and a logbook that allow you to plan and track your work.
The color of the dot indicates where on the site you will be working for that milestone (for example, blue dots correspond to the Data section). |
| milestone seminar |
 Scientific collaborations hold regular meetings to track progress on their projects. Leaders also schedule impromptu meetings for smaller groups focused on an aspect of the larger project. Teachers may hold milestone seminars to discuss your progress and understanding. Scientific collaborations hold regular meetings to track progress on their projects. Leaders also schedule impromptu meetings for smaller groups focused on an aspect of the larger project. Teachers may hold milestone seminars to discuss your progress and understanding.
|
| milestone seminar text |
Take this opportunity to discuss your progress and understanding with your teacher.
|
| milestone text |
 Scientists have software to plan and track their projects. Our online version includes these milestones with references and a logbook that allow you to plan and track your work.
 |
| project map |
Project Map
The Project Map is a graphical interface that guides you through the e-Lab. It is accessible from the main navigation bar.
To navigate the LIGO e-Lab, follow the arrows and complete the milestones. The small colored circles are milestones
Those with double circles are Milestone Seminars, opportunities to discuss your progress with your teacher. Hover over each circle to preview,
then click to open the milestone. Follow the instructions to complete the milestone.
Project milestones are on the four branch lines � The Basics, Get Started, Figure it Out and Tell Others.
|
| seismometer |
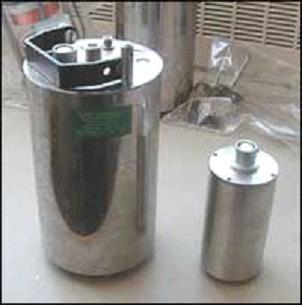
Seismometer
A seismometer is a device for measuring the motion of the earth. Seismometers can be used to detect earthquakes,
but they may also be used to detect other kinds of ground motion.
How they work
A magnetic test mass is suspended between two wire coils. As seismic waves pass through the seismometer,
the coils move, but the test mass remains at rest because of its inertia. The movement of the coils relative to the magnetic mass induces
an electric current that can be detected and plotted on a graphical interface.
|