|
1. Use time of flight to distinguish one-muon signals from two-muon background.
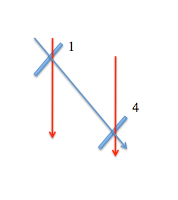
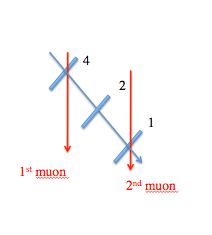
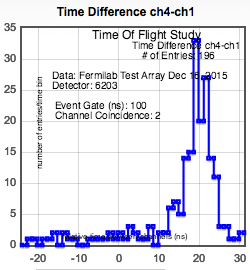
a.) Set up the following configuration to measure muons coming in at an angle.
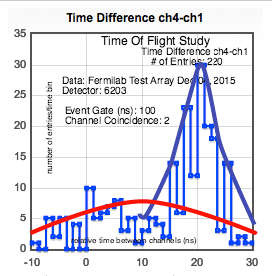
Make note of the curves representing the one-muon peak and the two-muon peak.
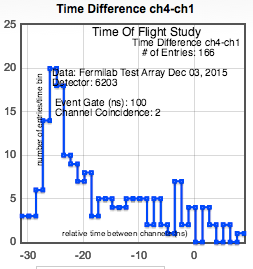
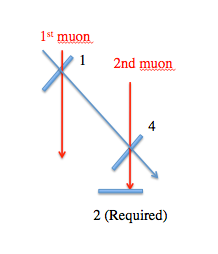
b.) Set up the configuration above with counter 2 between 1 and 4.
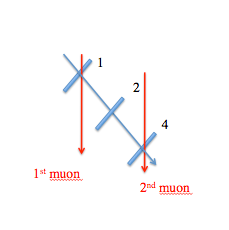
As you can see from the graph, the addition of counter 2 does not make much difference. We hoped that the two-muon peak would
be reduced, but we've also lost some one-muon events. So, perhaps counter 2 was not well aligned.
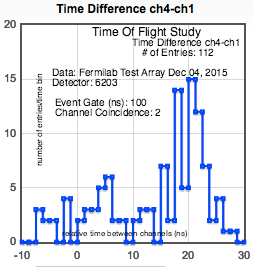
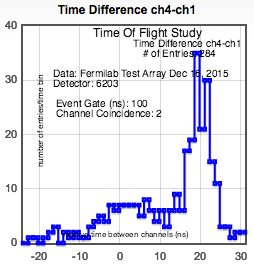
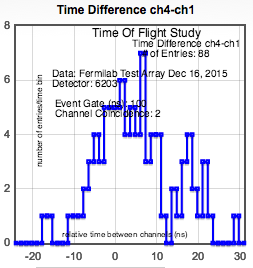
c.) Reverse the setup in b.) (reverse counters 1 and 4).
Notice that this graph is basically the mirror image of the graph in b.). Q: Why does this make sense?
| Run |
Peak Mean Traversal Time (mtt) (ns) |
Std. dev. of mtt (ns) |
√n |
Error on Mean=std.dev/√n(ns) |
| (a) 1-2-4 |
-23.87 |
2.58 |
9 |
0.29 |
| (b) 4-2-1 |
+19.82 |
2.46 |
10.7 |
0.22 |
2. The following series will use counter 2 in a different position.
a.) We shall start with a basic setup of just counters 1 and 4.
b.) The following configuration will also measure muons coming in at an angle. We include counter 2 (veto) below counter 4.
Note that the two-muon peak has been reduced.
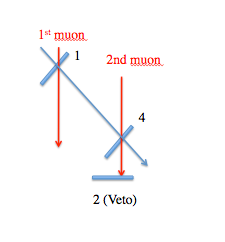
c.) If we require all three counters, a single muon cannot satisfy the trigger.
We see that the two-muon peak is greatly enhanced.
|
